|
|
DISROC Examples |
|
| DISROC 5 - Example: |
Other Examples |
Ground Freezing in Tunneling
The artificial ground freezing technique is used in tunneling to provide temporary earth support and
groundwater control. Frozen soil has greater strength and lower permeability than unfrozen soil.
In the most common freezing approach for tunnel excavation, the refrigeration pipes are installed
horizontally around the perimeter of the tunnel. A successful ground freezing design requires that the
pipe spacing, refrigeration load, and refrigeration time required to achieve a frozen area of sufficient
thickness be properly evaluated.
The groundwater flow introduces additional heat into the freezing zone which opposes freezing. Conversely
, freezing decreases the permeability of the soil and opposes the flow of the fluid. These effects make
soil freezing a fully coupled hydrothermal process. If the effects of freezing on mechanical properties
(especially strength) are also considered, a coupled thermo-hydro-mechanical problem needs to be modeled.
Disroc provides a fully operational numerical tool to model freezing process and design ground freezing
technique for engineering applications.
Theoretical basis
The GeliSol material model of Disroc dedicated to model ground freezing effects has a threefold
mechanical, hydraulic and thermal constitutive model.
The mechanical behavior corresponds to a Mohr-Coulomb elastoplastic material with 6 parameters which are:
Young's modulus, Poisson's ratio, cohesion, frication angle, dilatation angle and tensile strength
cutoff. All these parameters can vary between initial and final values corresponding respectively to the
unfrozen and frozen states of the ground. However, it suffices to model only the variation of the
cohesion which is the most determining and to consider the other parameters constants.
The hydraulic model corresponds to the Darcy's law with and evolving permeability. The permeability
depends on the unfrozen water content Sλ which decreases with freezing from a maximum value corresponding
to the unfrozen state to a minimum value for the frozen state. The variation of Sλ with the temperature
is given by the thermal model of GeliSol.
The thermal model includes the heat transport equation and the freezing behavior. The heat flow has a
diffusive part depending on a scalar thermal conductivity Λ and an advective flow depending on the fluid
velocity which results from the hydraulic calculation. The function Sλ(T) is determined by the freezing
behavior of the soil.
Figure 1 summarizes the constitutive equations of the GeliSol model.
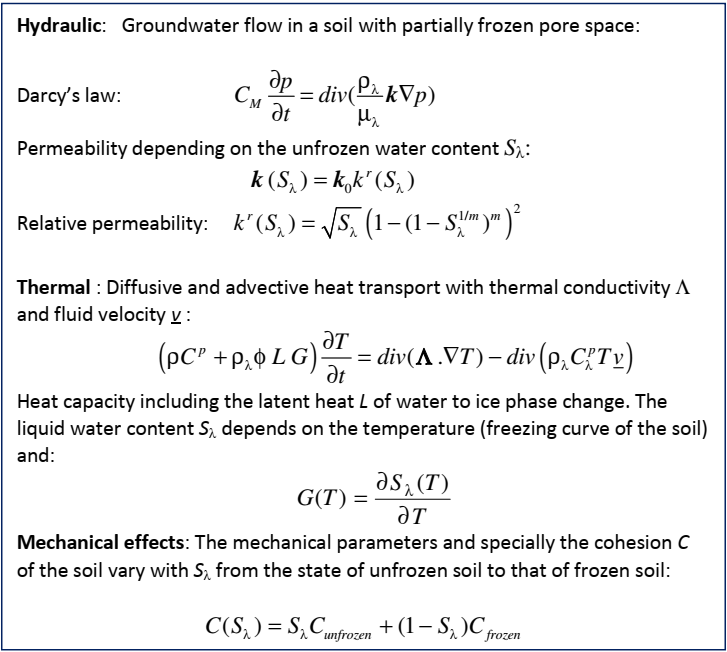 Figure 1: Main constitutive equations of the Thermo-Hydro-Mechanical GeliSol material
|
The freezing curve of the soil can be defined by simple linear model supposing that the entire freezing process takes place between 0°C and Tmin < 0, or by a set of (T, Sλ) values given by the user (Figure 2).
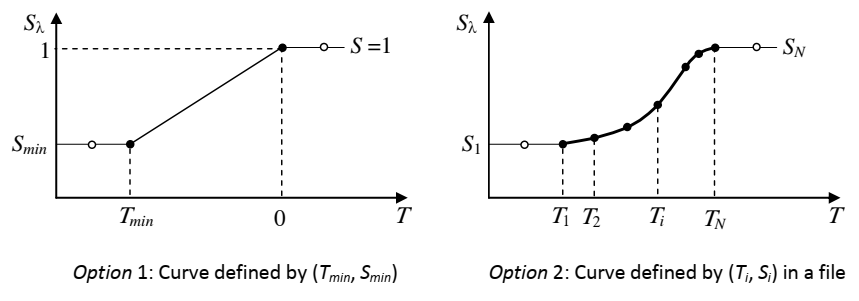 Figure 2: Two methods of definition of the freezing curve of the GeliSol material
|
The following figure shows the parameters that must be specified for the GeliSol model.
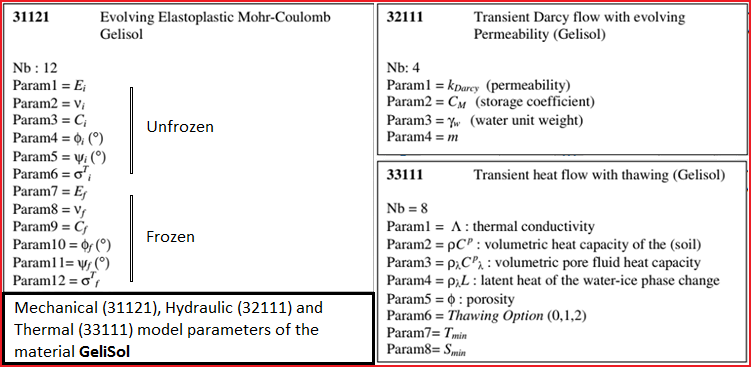 Figure 3: Parameters required for the mechanical, hydraulic and thermal properties of GeliSol
|
When the frozen zone around the tunnel reaches a sufficient thickness, the convergence due to the
digging of the tunnel is limited to the admissible values.
Example
A 2.90 m radius tunnel about 40 m deep in a layer of weathered chalk (Chalk-W) is studied. Weathered
chalk rests on a layer of sound chalk (Chalk-S) and is covered with a layer of alluvium (Figure 4).
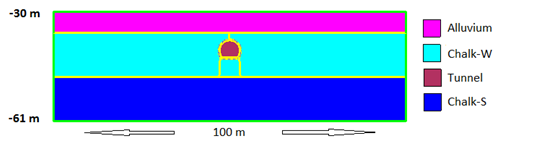 Figure 4: Geometry of the tunnel model
|
The weathered chalk is modeled by the GeliSol material model while two other layers are modeled by simple
thermo-poroelastic materials. For the weathered chalk, the values of parameters defined in the Figure 3
are given in the Figure 5.
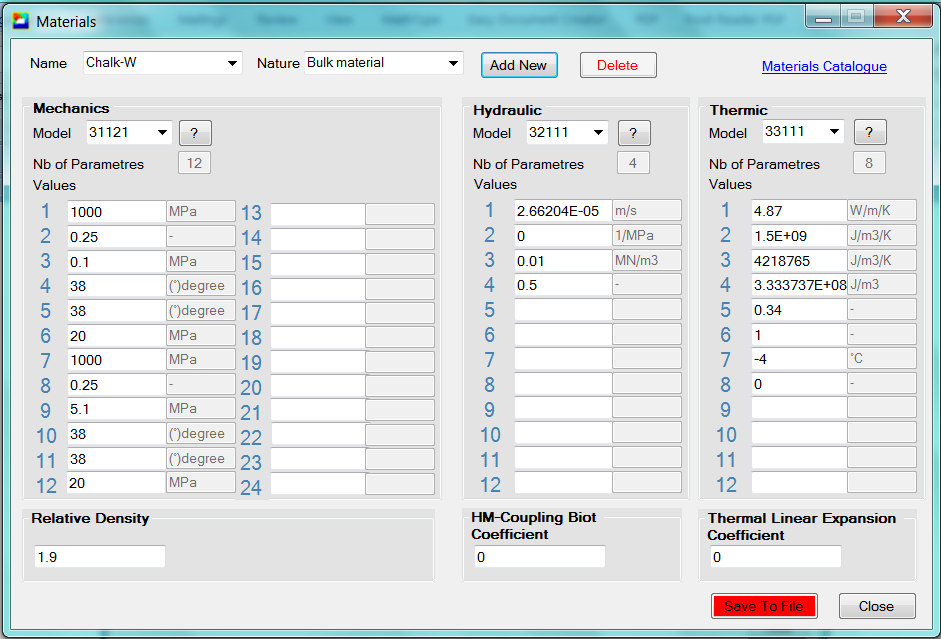 Figure 5: GeliSol parameters specified for weathered chalk layer (Chalk-W)
|
First mechanical loads are applied to the model to create the ground stresses corresponding to gravity
forces. The excavation is modeled at this point just to see what the convergence would be without
freezing. The results are shown in the Figure 6 and 7. With a cohesion of 500 kPa, there is a plastic
zone around the tunnel and a maximum radial displacement of 12 cm. This leads to a ratio of the
convergence on the radius Ur/R greater than 4 %.
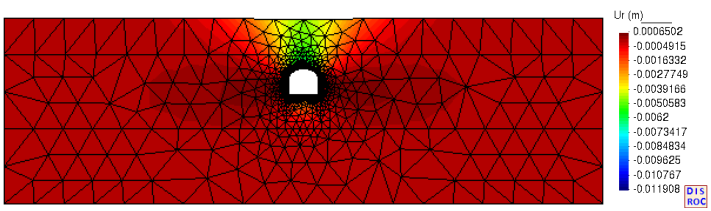 Figure 6: Displacement Ur due to digging without freezing: maximum value about 12 cm
|
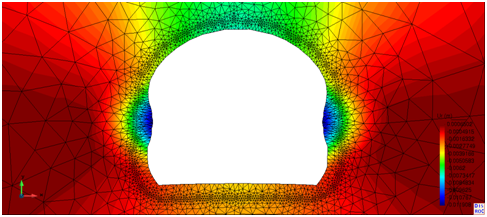 Figure 7: Detail of displacement due to digging without freezing on deformed mesh
|
The freezing process is modeled in the presence of a groundwater flow. A fluid velocity condition equal
to 2.3 m/day is applied to the left and right boundaries (flow from left to right) whiles the top and
bottom sides are supposed to be closed boundaries. These hydraulic conditions with the existing
mechanical loads are kept constant in all the subsequent stages.
The thermal conditions are applied on the model in three steps (Figure 8) .
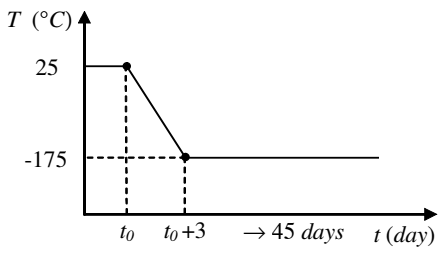 Figure 8: Temperature conditions applied in three steps to model the refrigeration process
|
At first the initial uniform temperature of 25°C is applied in a time independent process to the domain.
The temperature condition is applied on the boundary as well as on the freeze pipes placed in the model
(Figure 9). Mesh details for the elements representing the freeze pipes are shown in Figures 10.
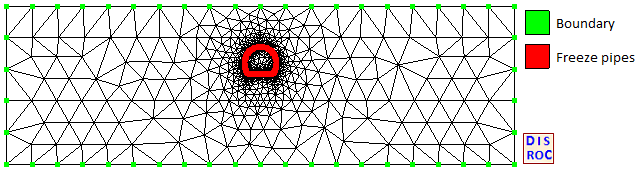 Figure 9: Thermal conditions applied on the boundary and freeze pipes
|
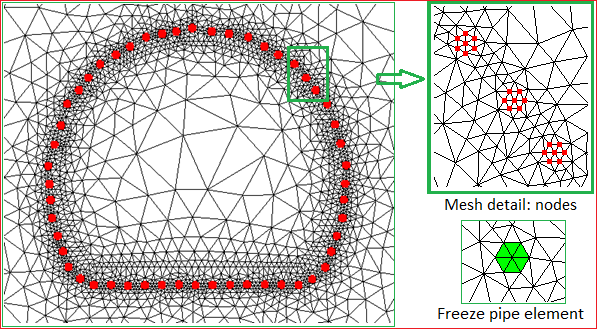 Figure 10: Detail of freeze pipes installed around the tunnel perimeter
|
In the second step, the temperature is lowered from 25 °C to -175 °C in 4 days in a transient process.
This corresponds to applying a temperature change rate of -50 °C/day to the freezing elements.
In the last step, the temperature is kept constant on the freezing pipes as well as the domain
boundary for a transient process. This freezing process lasts 45 days in this example.
The zone of negative temperatures after 45 days of freezing is shown on the Figure 11 (click on the image to see video animation).
Click to see video animation!
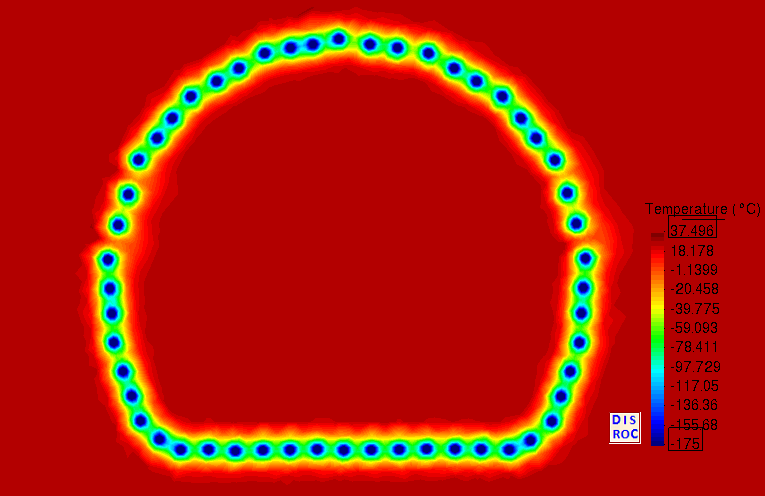 Figure 11: Temperature field after 45 days freezing (click on the image to see video animation)
|
Note that the permeability also decreases with freezing and the frozen ring created around the section of
the tunnel prevents the flow of fluid in this area (Figure 12)(click on the image to see video animation).
Click to see video animation!
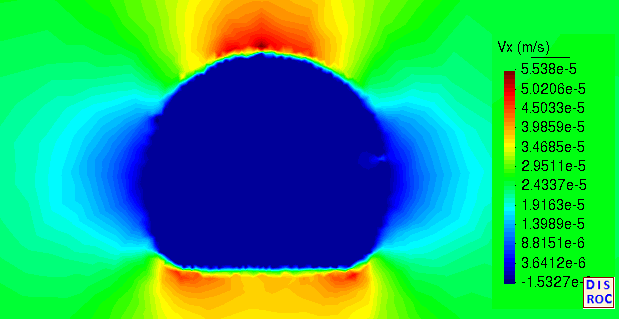 Figure 12: Fluid velocity Vx after 45 days freezing (click on the image to see video animation)
|
The cohesion of the frozen soil is taken equal to 5 MPa. Freezing creates a ring-shaped area around the
perimeter of the tunnel with cohesion of about 5 MPa. This area acts as a temporary support during the
excavation process (Figure 13)(click on the image to see video animation).
Click to see video animation!
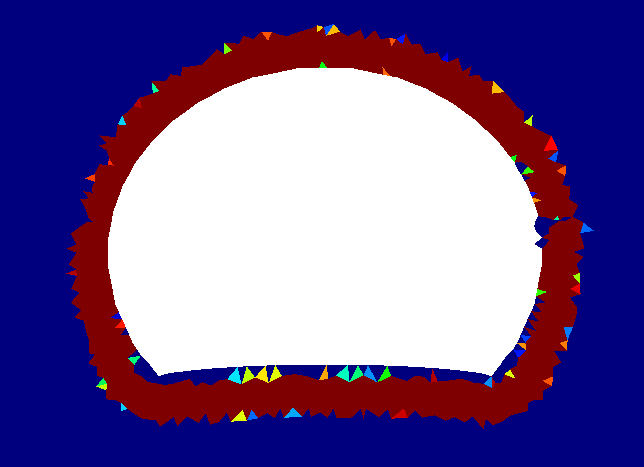 Figure 13: After 45 days of freezing, a ring of approximately 40 cm thick of frozen soil with high
cohesion, about 5 MPa, is created around the section of the tunnel. Dark red corresponds to the maximum
value of 5 MPa and dark blue to the minimum of 500 kPa (click on the image to see the video animation).
Figure 13: After 45 days of freezing, a ring of approximately 40 cm thick of frozen soil with high
cohesion, about 5 MPa, is created around the section of the tunnel. Dark red corresponds to the maximum
value of 5 MPa and dark blue to the minimum of 500 kPa (click on the image to see the video animation).
|
A freezing anomaly is observed in a small area halfway up the right wall of the tunnel. The cohesion does
not reach its maximum value in this zone and the ring-shaped zone is not completely closed after 45 days
of freezing. This anomaly is due to the flow of the fluid which concentrates on this point when the gel
in other areas prevents the fluid from passing there. This phenomenon can be observed on the diagram of
the velocities at intermediate times (see the video animation of the evolution of the fluid velocity).
The stress anomaly induced by this phenomenon is visible also in Figure 14 showing the radial stress.
This anomaly can be corrected by increasing the density of the freezing pipes.
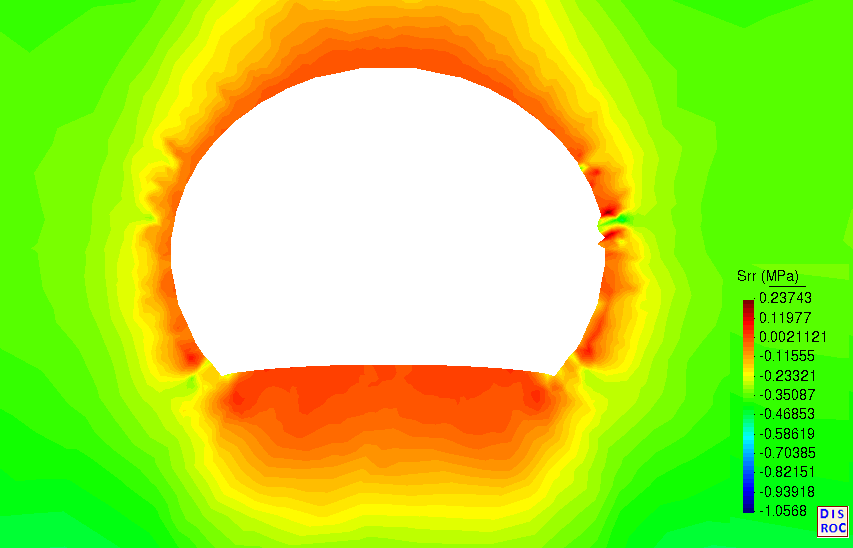 Figure 14: Radial stress σrr after 45 days freezing. A freezing anomaly creates a small area of stress
anomaly at halfway up on the right wall.
Figure 14: Radial stress σrr after 45 days freezing. A freezing anomaly creates a small area of stress
anomaly at halfway up on the right wall.
|
The analysis of the displacement field proves that this freezing process is sufficient to limit the
convergence induced by the excavation to acceptable values. In fact, the maximum radial displacement
observed after total excavation is about 5 mm (Figure 15). For 290 cm tunnel radius this leads to an
Ur/R which is less than 0.2%.
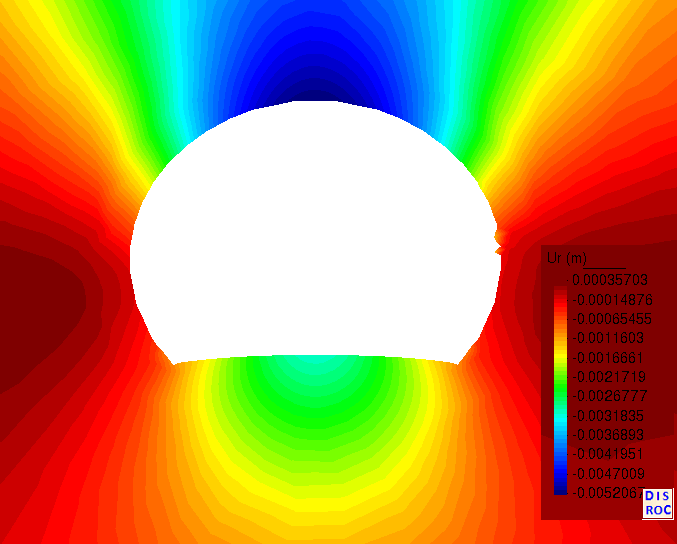 Figure 15: The maximum displacement on the wall after total excavation in the frozen ground is about
5 mm for a tunnel diameter of 290 cm.
Figure 15: The maximum displacement on the wall after total excavation in the frozen ground is about
5 mm for a tunnel diameter of 290 cm.
|
The bibliographic references below provide more information on the freezing process and its use for
geotechnical structures.
References
Sopko, J.A. Design of ground freezing for cross passages and tunnel adits. Moretrench, A Hayward Baker Company, Rockaway, NJ, USA :
paper
Sopko, J., 2017. "Coupled Heat Transfer and Groundwater Flow Models for Ground Freezing". ASCE GeoFlorida, Orlando :
paper
Tounsi, H. et al. Thermo-Hydro-Mechanical Modeling of Artificial Ground Freezing: Application in Mining
Engineering. Rock Mech Rock Eng 52, 3889-3907 (2019):
paper
AFGC - La Technique Française du Béton. "LA CONGÉLATION DES SOLS APPLIQUÉE AUX TUNNELS CONSTRUITS AU
TUNNELIER - DÉVELOPPEMENTS RÉCENTS ET PERSPECTIVES":
paper
Colombo G, Lunardi P, Cavagna B, Cassani G, Manassero V (2008). The artificial ground freezing
technique application for the Naples underground:
paper
Websites:
groundfreezing.com
GEOFROST
Max Bögl
BAUER SOIL FREEZING